Introductory6 min2026-05-13Open
Candlestick Anatomy
Body and wick. Two elements that draw market psychology. Marubozu, spinning tops, hammers, shooting stars, doji — what the basic forms say about the battle within.
CandlestickBullishBearishWickBody
Overview
The candlestick chart was born in 18th-century Japanese rice trading. A single candle compresses four prices from a period (a day, an hour) — open, high, low, close — into one visual mark.
A candle has just two components: the body and the wick (shadow). From the lengths and positions of these two alone, you can roughly read what happened between buyers and sellers during that period. Before memorising complex pattern names, understanding this "grammar" is the foundation of everything.
Anatomy
Four prices
| Element | Meaning |
|---|---|
| Open | The first price of the period |
| Close | The last price of the period |
| High | The highest price of the period |
| Low | The lowest price of the period |
The body
The rectangle between open and close.
- Bullish candle (usually white/green): close > open. Buyers pushed through.
- Bearish candle (usually black/red): close < open. Sellers pushed through.
Body length = how forcefully one side pushed in its direction.
The wick (shadow)
The thin lines extending from the body.
- Upper wick: between the high and the body's top. Price went there once, then was pushed back.
- Lower wick: between the low and the body's bottom. Price went there once, then was bought back.
Wicks mark "rejected price zones". A long upper wick = sellers rejected "this price is too high". A long lower wick = buyers rejected "this price is too low".
What the Basic Forms Say
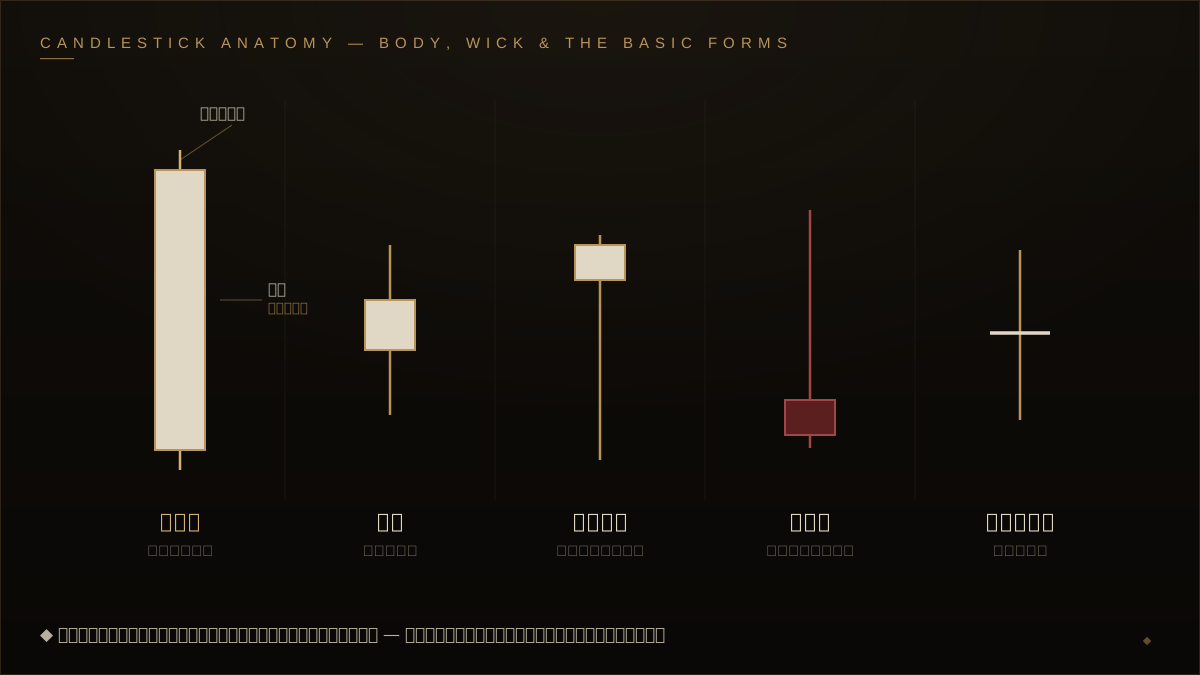
Long bullish / bearish candle (near-marubozu)
Long body, almost no wick.
- Long bullish: buyers pushed nearly one-sidedly from open to close. Strong demand. Appearing at a low can signal a bottom; a series at a high may be "the final surge" (distribution).
- Long bearish: sellers pushed one-sidedly. Strong supply.
Because their range is large, long candles also serve as later S/R reference.
Spinning top (small bullish / bearish)
Short body, moderate wicks both sides.
Buyers and sellers were balanced; neither pushed through. Loss of direction. Mid-trend it means "a pause"; at the end of a trend it can hint at a turn. Alone it decides nothing — context is required.
Hammer / hanging man
Small body near the top, lower wick at least twice the body, almost no upper wick.
Price was sold off hard during the period, then bought back violently from the low.
- At the bottom of a downtrend → "hammer". Sellers may be exhausted; buyers counterattacked → possible reversal.
- At the top of an uptrend → "hanging man". Same shape, opposite context. A violent sell-off during an uptrend = the footing may be cracking.
The same shape means opposite things depending on where it appears. This is the single most important principle in reading candles.
Shooting star / inverted hammer
The hammer flipped. Small body near the bottom, upper wick at least twice the body, almost no lower wick.
Price was bought up hard, then sold back violently from the high.
- At the top of an uptrend → "shooting star". The ceiling of upside, a reversal hint.
- At the bottom of a downtrend → "inverted hammer". A possible bottoming (less reliable than a hammer, generally).
Doji (cross / 寄引同時線)
Open = close (nearly). Almost no body; looks like a cross.
Buyers and sellers were perfectly balanced — a draw. Extreme indecision, or a turning point.
- At the end of a trend → the trend's energy may be spent. Watch for a turn.
- Long-legged doji → violent swings both ways but back to the start = great indecision.
- A doji with a long upper wick (gravestone) vs. a long lower wick (dragonfly) carries different nuance.
How to Use It
1. Read the body first, then the wick
"Bullish or bearish (who controlled the floor)" → "body length (how one-sided)" → "wick length and position (where price was rejected)".
2. Always judge with context
- Where it appeared: a long lower wick near support carries weight; one in mid-air does not
- Which phase of the trend: a hammer at a bottom vs. a hanging man at a top are opposite
- Was there volume: a long bullish candle on volume is more reliable
- What the next candle did: if a bullish candle the day after a hammer exceeds the hammer's high, the bottoming case strengthens
3. Prioritise higher-timeframe candles
A daily candle far outweighs a 5-minute candle. One daily bullish candle is the day's collective buyer verdict. Look at daily/weekly shapes before getting lost in short-timeframe noise.
How to Read
OANDA:USDJPY
Chart Example
Limitations
- Weak alone: candle readings without context are unreliable
- Timeframe-dependent: a 5-minute doji and a daily doji carry very different weight
- Hindsight-prone: often you only know "that was the bottom" after the reversal
- Many fakeouts: a "clean hammer" frequently fails to reverse
Related Studies
- Evening Star: a three-candle reversal pattern
- Support & Resistance: a candle's meaning is set by "where it appeared"
- Dow Theory: the structure of highs and lows that candles form in sequence
Related Studies
Evening Star
A three-candle reversal pattern appearing at the top of uptrends. One of the most reliable bearish reversal signals in candlestick analysis.
Support & Resistance
The single most important concept in technical analysis. The 'walls' where price stalls, bounces, and swaps roles — explained through order clustering and crowd psychology.