Introductory5 min2026-05-13Open
Support & Resistance
The single most important concept in technical analysis. The 'walls' where price stalls, bounces, and swaps roles — explained through order clustering and crowd psychology.
SupportResistanceLevelsRound Numbers
Overview
Support is a level price struggles to fall below; resistance is a level it struggles to rise above. No concept in technical analysis is more universal. Trend lines, chart patterns, Fibonacci — at bottom, they are all just other ways of saying "where is the support and resistance".
What matters: treat S/R as a zone, not a line — and understand why price stalls there. Once you understand the why, you can also anticipate the moment it breaks.
How to Read
OANDA:USDJPY
Where Support / Resistance Forms
1. Prior highs and lows (swing points)
The most basic S/R. A low that bounced repeatedly tends to be support again. A high that capped price repeatedly tends to be resistance again. This is Dow Theory's "structure of highs and lows" itself.
2. Round numbers
USDJPY at 150.00, 151.00; a stock at ¥1,000, ¥3,000 — humans psychologically cluster orders at round numbers. Limit orders ("sell at exactly 150") stack there, so price tends to stall. Levels ending in 00 (150.00) are watched more strongly than levels ending in 50 (150.50).
3. High-volume price zones (volume profile)
A zone where heavy trading occurred means many participants hold positions from there. When price returns, their "break-even exits" and "averaging-down" tend to appear, making it S/R.
4. Dynamic levels (moving averages, etc.)
Famous moving averages (the 200-day, etc.) are watched by many, so they can act as S/R themselves. → See Moving Average
Role Reversal (Resistance ⇄ Support)
The single most important principle in S/R theory:
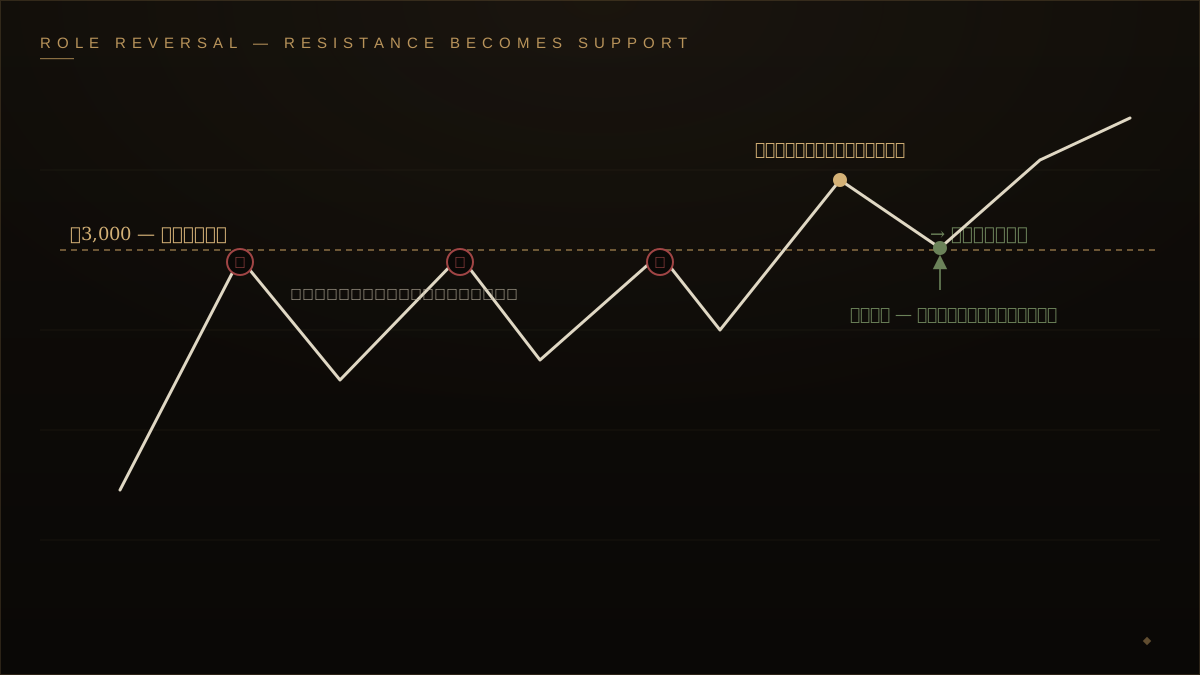
Resistance, once broken, becomes support. Support, once broken, becomes resistance.
Example: a stock capped at ¥3,000 repeatedly (resistance) → one day it clearly clears ¥3,000 → afterwards, when a pullback returns to ¥3,000, it bounces there (now support).
Treat S/R as a Zone
A beginner's mistake is treating S/R as a single line ("exactly ¥3,000"). In reality price reacts in a zone ("¥2,980–¥3,020").
Why:
- Wicks and bodies stop at slightly different levels
- Institutions split orders across a range, not at one price
- Past bounce points were never perfectly aligned either
So instead of "stop out one tick below ¥3,000", think "stop out if the close clearly breaks the ¥2,980 zone".
How to Use It
Counter-trend: buy the pullback at support
- Identify a clear support zone (multiple touches, ideally higher timeframe)
- Wait for price to fall into the zone
- Confirm signs of a bounce within the zone (lower wick, volume increase, a reversal candle)
- Buy after confirmation — do not catch the falling knife
- Stop on a clear break below the zone
- Target the next resistance zone
With-trend: breakout + retest
- A clear close-basis break above resistance
- Don't chase; wait for the retest (pullback to old resistance = new support)
- Buy if the retest bounces
- Stop on a clear break below the new support (the break was a fakeout)
Waiting for the retest avoids most fakeouts. But in strong trends price may run without retesting, and you miss it. That is a trade-off.
Chart Example
Limitations
- Many fakeouts: especially wick-only breaks
- Discretion in where the "zone" ends
- Powerless against strong trends or news: any S/R can be pierced
- Hindsight-prone: often you only know "that was support" after the bounce
Related Studies
- Dow Theory: highs and lows form S/R
- Trend Lines: diagonal S/R
- Moving Average: can act as dynamic S/R
Related Studies
Dow Theory
The foundation of all technical analysis. The definition of trend and six core tenets, read through the lens of crowd psychology.
Trend Lines & Channels
The simplest tool and the most misused. How to draw trend lines correctly, what makes them valid, how to judge a break, and the trap of discretion.