Introductory6 min2026-05-13Open
Dow Theory
The foundation of all technical analysis. The definition of trend and six core tenets, read through the lens of crowd psychology.
Dow TheoryTrendFoundationsHighs and Lows
Overview
Dow Theory, articulated by Charles Dow at the end of the 19th century, is the starting point of virtually all modern technical analysis. Moving averages, trend lines, Elliott Wave — all rest on the concept of "trend" that Dow Theory defines.
Dow Theory answers one question: "Is the market currently rising, falling, or neither?" Without a shared language for that, no meaningful conversation about price is possible.
How to Read
OANDA:USDJPY
The Six Tenets
1. The averages discount everything
Price reflects every known piece of information — economic data, rates, supply and demand, expectations, rumour. A method premised on "information nobody else has" therefore cannot exist in principle. This prefigures the efficient-market hypothesis. The implication: anyone selling you "special information only you have" is lying.
2. There are three kinds of trend
| Type | Rough duration | Analogy |
|---|---|---|
| Primary | Months to years | The tide |
| Secondary | Weeks to months | Waves against the tide |
| Minor | Days or less | Ripples on the waves |
Secondary trends are corrections within the primary trend, often retracing one-third to two-thirds of it. Confusing which timeframe you are trading collapses your judgement.
3. Primary trends move through three phases
A bull market
- Accumulation — peak pessimism; the informed few quietly buy; the news is dark.
- Public participation — the trend becomes obvious; technical traders and the public pile in; the largest moves occur here.
- Distribution — peak optimism; media and social feeds shout "easy money"; the accumulation buyers sell to the last latecomers.
A bear market mirrors this (distribution → panic → despair).
4. The averages must confirm each other
Dow watched two indices (industrials and railroads) and held that a trend change is confirmed only when both make a new high (or low) in the same direction. A move in one alone is a divergence — low reliability.
The modern application: check whether multiple related markets or indicators (an index and its futures, consistency across major currency pairs, sector co-movement) are giving the same signal. Do not trade on a single indicator.
5. Trends are confirmed by volume
Volume expands in the direction of the primary trend and contracts against it.
- Uptrend, healthy: volume up on rallies, down on pullbacks
- Uptrend, warning: volume thinning on rallies, expanding on declines — the public phase may be ending
Volume measures how many participants are seriously committed to a move. A new high on thin volume is not trustworthy.
6. A trend persists until a clear reversal signal
This is the core, and the most practical part.
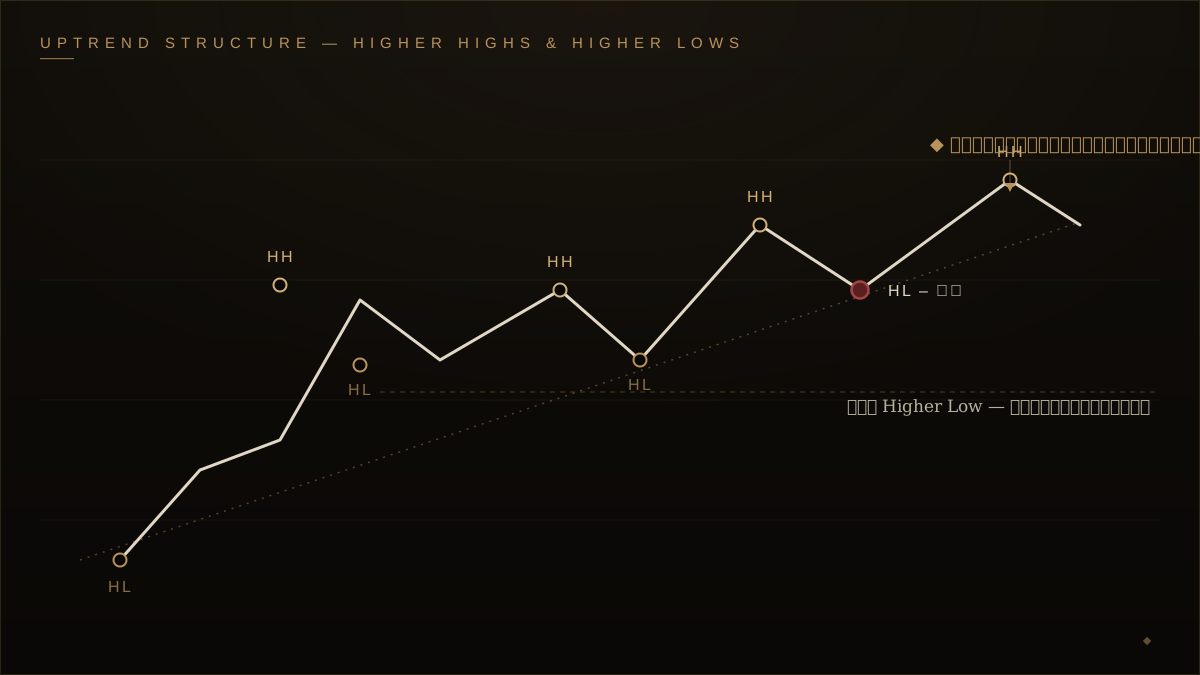
Uptrend definition: higher highs and higher lows, in sequence.
Downtrend definition: lower lows and lower highs, in sequence.
Reversal conditions:
- Uptrend ends → price clearly breaks below the most recent significant higher low
- Downtrend ends → price clearly breaks above the most recent significant lower high
In other words, "it looks high" or "it's gone up too far" does not end a trend. Only a break in the price structure itself does.
How to Use It
Define the trend
When you open a chart, the first thing to do is sequence the highs and lows.
- Mark the recent prominent highs and lows in order
- Higher highs and higher lows → uptrend
- Lower lows and lower highs → downtrend
- No clear direction in either → trendless (range)
Do this across multiple timeframes. Daily uptrend, hourly downtrend is normal — that is just a secondary trend (a pullback) inside the primary.
Wait for the trend to "end"
The most disciplined Dow-style trade:
- In an uptrend → wait for a pullback (a higher low forming) and buy
- If the most recent higher low breaks → treat the uptrend as over, exit longs
Abandon the urge to "sell the top". Wait until the structure breaks. This alone prevents many premature stops and premature exits.
Chart Example
Reading Market Psychology
Limitations
- Hindsight-prone: highs and lows are only known after they form
- Discretion in which highs/lows count as "significant"
- Useless in ranges: it is a trend definition, so it is silent when there is no trend
- The "clear break" threshold varies between people
Related Studies
- Trend Lines: visualising the Dow trend with lines
- Support & Resistance: the horizontal walls formed by highs and lows
- Moving Average: smoothing the trend numerically
Related Studies
Trend Lines & Channels
The simplest tool and the most misused. How to draw trend lines correctly, what makes them valid, how to judge a break, and the trap of discretion.
Support & Resistance
The single most important concept in technical analysis. The 'walls' where price stalls, bounces, and swaps roles — explained through order clustering and crowd psychology.