Intermediate5 min2026-05-13Open
Double Top & Bottom
Two peaks, two troughs. The simplest reversal pattern, marking 'the failure of the second attempt'. Neckline, target, and the moment the M or W completes.
Double TopDouble BottomReversalNecklineChart Pattern
Overview
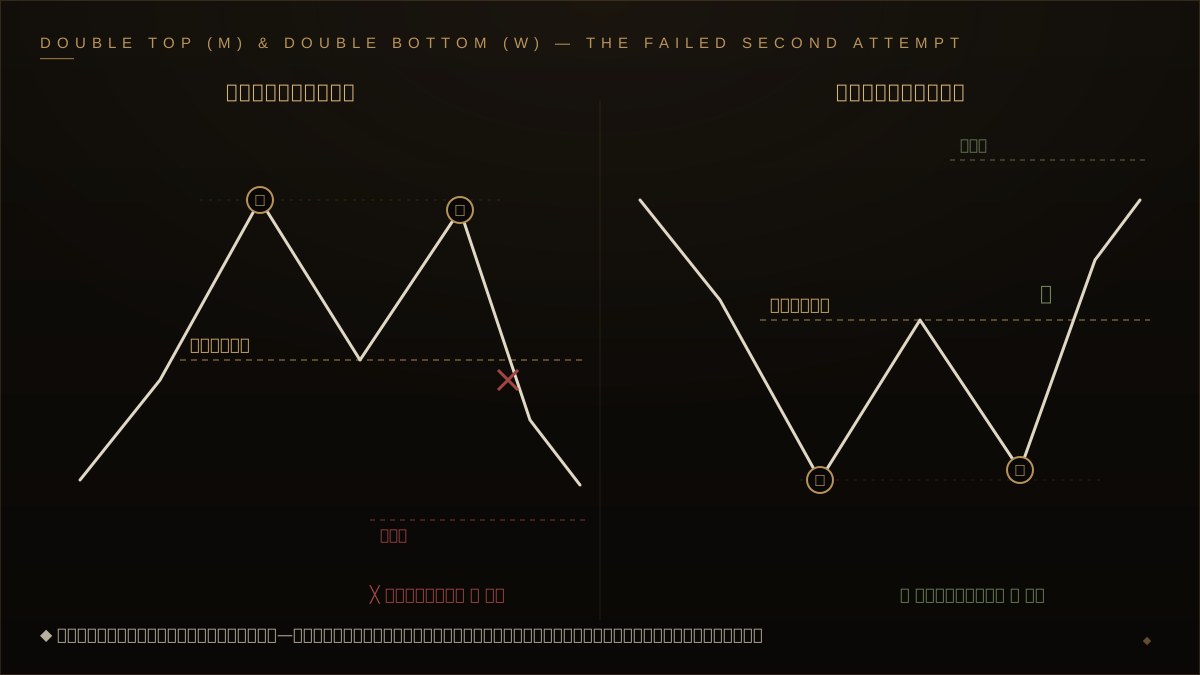
A double top (an "M top") forms two roughly equal peaks at the top of an uptrend, then reverses. On the chart it looks like the letter "M".
A double bottom (a "W bottom") is the inverse — two roughly equal troughs at the bottom of a downtrend, then a reversal. It looks like a "W".
Simpler than a head and shoulders, and more frequent. Its essence: "price tried the same level a second time and could not exceed it". That means the force driving the trend has finally reached its limit.
The Structure (a Top)
- First peak (left peak): a high within the uptrend, then a pullback (just a pullback so far)
- Trough (neckline level): the pullback low — this later becomes the "neckline"
- Second peak (right peak): another rally reaching roughly the first peak's height — but failing to exceed it. In Dow Theory terms, the failure to make a new high. Buyers have lost the strength to push another leg higher.
- Neckline break: the decline from the second peak clearly breaks below the trough (the neckline) on a close basis → the double top completes, the reversal is confirmed.
The neckline
The trough between the two peaks. Usually roughly horizontal.
The double top is "complete" only when the neckline is clearly broken on a close basis. Front-running a short while the second peak is still forming is betting on an unconfirmed pattern. If the second peak exceeds the first on a close basis, it is simply uptrend continuation — the double top "never happened".
Measuring the Target
The traditional downside target on completion:
Formula
Target = neckline-break price − (peak's high − neckline)
Project the vertical distance from the peak's high to the neckline downward from the break point. For a double bottom, project it upward.
Example: peak high ¥3,100, neckline ¥3,000 → vertical distance ¥100. On breaking ¥3,000, the target is ¥2,900.
A guideline only. After the neckline break a "retest" (a pullback toward the neckline) often occurs — that level (old support = new resistance) is an excellent rally-sell point.
How to Use It
Short entry on a double top
- After an uptrend, two roughly equal peaks line up
- Confirm the second peak failed to exceed the first on a close basis
- Wait for a clear close-basis break of the neckline (the trough between the peaks)
- Enter just after the break, or wait for the retest for a better price
- Stop just above the peaks' high (above that, the pattern is invalidated)
- First target the calculated value; second target the next major support
Long entry on a double bottom
Invert all of the above. After a downtrend, two roughly equal troughs, the second not breaking the first on a close basis, and a close-basis break above the neckline → buy.
How to Read
OANDA:USDJPY
Chart Example
Limitations
- Worthless before completion: just an "M-ish shape" until the neckline break
- Many fakeouts: a famous pattern is a stop-hunt target
- Sometimes ambiguous vs. a head and shoulders: a small peak in the middle blurs the line
- The target is a guideline: not guaranteed to reach or stop there
Related Studies
- Head and Shoulders: a more complex three-peak reversal
- Support & Resistance: two peaks are two tests of the same resistance
- Dow Theory: "failure to make a new high" is the reversal signal
Related Studies
Head and Shoulders
The most famous reversal pattern. Three peaks marking the limit of a trend, the neckline, how to measure the target, and the trap of the 'too-clean' head and shoulders.
Support & Resistance
The single most important concept in technical analysis. The 'walls' where price stalls, bounces, and swaps roles — explained through order clustering and crowd psychology.